01
Visible-chart capture only
No manual candle entry. The extension captures the visible chart directly from the active tab after a deliberate user action.
AI Stock Chart Analyst is a Malisasa free beta tool for AI-assisted educational chart reading. It generates chart-reading summaries from visible stock chart screenshots, then returns support, resistance, reasoning, confidence, and risk warnings inside the browser side panel.
AI-assisted educational chart reading for support, resistance, reasoning, and risk warnings.
Public installation links will be added after Chrome and Edge review are approved.
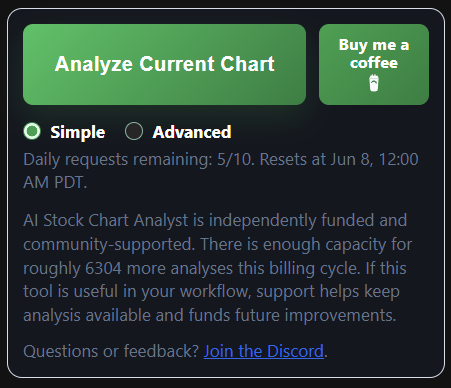
Malisasa is independently funded. If it is useful in your workflow, you can support the project here.
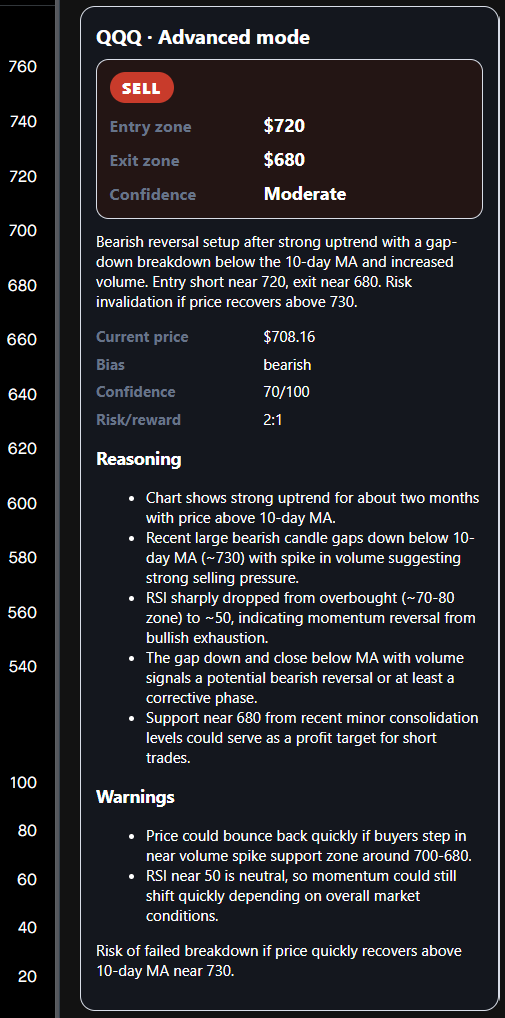
Advanced mode returns structured bias, confidence, price levels, reasoning, and risk warnings directly inside the side panel.
The tool is intentionally narrow: it reads the visible chart, returns an educational technical interpretation, and keeps the result compact enough for fast review.
No manual candle entry. The extension captures the visible chart directly from the active tab after a deliberate user action.
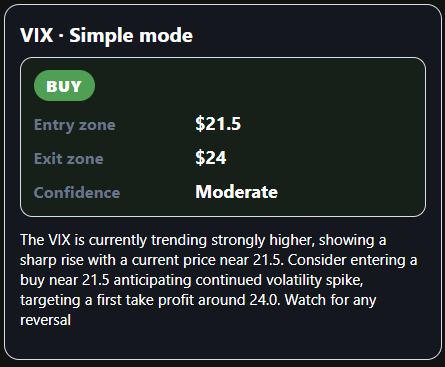
Simple mode stays concise. Advanced mode adds directional context, confidence, reasoning, and risk warnings.
Signed-in users can see daily request status and product capacity messaging before using another analysis request.
The product detail page is public now even while the browser store listings are still under review.
Free beta tool. Browser store listing pending review.
Generates educational chart-reading summaries from visible stock chart screenshots already on screen.
Support, Privacy Policy, and Terms of Use remain public before install links go live.
The product is explicit about when a screenshot is captured and when backend processing occurs.
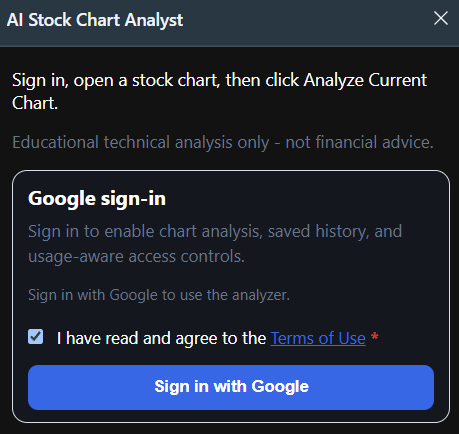
Sign in with Google, then navigate to the stock chart page you want to review.
The extension captures the visible chart screenshot and sends it to the hosted backend for AI-assisted analysis.
Review support and resistance context, entry and exit zones, confidence, reasoning, and risk warnings in the side panel.
These are current product captures from the extension flow.
AI Stock Chart Analyst is for chart review context, not personalized recommendations or guaranteed outcomes.
Malisasa does not provide investment advice, financial advice, personalized recommendations, or guaranteed returns.
Chart screenshots are sent to the backend only after the user clicks Analyze Current Chart.
Google sign-in is required, public legal pages stay available at all times, and support can be reached at support@malisasa.com.